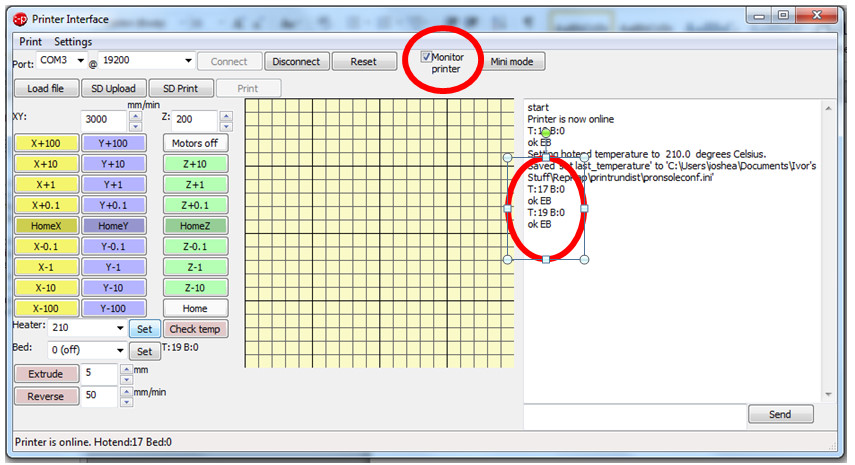
I wondered if there was a better way to log the temperature change over time as the heater block warmed up. It's only something you'd do occasionally if you were assessing something in particular, so it's just a bit of fun, and may be of value to others. I had observed how Pronterface would read the temperature at regular intervals and echo the reading to screen, once the 'monitor printer' box is checked. If you leave it 'echo' as the heater block warms up it will log that entire process in the window.
Once a desired temperature is reached you can scroll back through that entire data stream selecting it as you go. Then copy/paste to Excel. You can clean it up quickly in Excel by adding Headers, Filter on Column A, only selecting rows beginning with "T". Copy/past those readings to a new Tab. The slightly unscientific bit is adding the time-line. My estimate is that there are 3seconds between the temperature readings, so with that info added to a second column I was able to graph my temperature graph (below).
Graph of Heater Block heating from room temperature to operating temperature, with cooling fan 'on' and 'off'

Other detail: Target temperature set to 210Deg C, 12v supply, aluminium heater block with 6ohm resistor, 100k thermistor, Gen6 electronics, 'teflon' lagging jacket!
Observations: Despite the heater block never reaching target temperature, I could see the PLA beginning to ooze from the nozzle as the temperature passed 170Deg C, and if I manually fed turned the cogs it would easily extrude plastic which from experience I could see was flowing well enough to start printing with.
If I allowed it to heat further I could hear the plastic beginning to crackle, so I cut off the heater. That's where you see the 'no fan' graph top out at about 190Deg C after about 3.5minutes.
All my printing in the previous post was done with a temperature reading levelling out at about 185Deg C, but never reaching the target temperature of 210Deg C (which I know is a bit high anyway).
Conclusions: I have a lot more to learn about the heating process, the feedback loop, and calibrating it.
I need to measure the temperatures accurately (borrow a digital thermometer) if I'm to understand better what's going on!
The fan could be having a cooling effect on the thermistor (they are both on the same site. I might move the fan and observe what happens, now that I have an easy way to graph the heating process.
I don't know how it is self-regulating to a nice temperature for printing, other than the fan is balancing the temperature nicely (seems unlikely).
Note: If I've got my estimate of the temperature reading interval wrong in Pronterface then my graphs are off (but not my much hopefully!). [Now don't anyone tell me there's a button in the program to graph all this already! :) ]
Feel free to drop me an email or post comment if you have anything to share on control or calibrating this heating process.
Contactable on forums.reprap.org Username "NumberSix"
No comments:
Post a Comment
Note: Only a member of this blog may post a comment.